


Over recent weeks following the first commercial offerings for virtual reality (VR) hardware, the HTC Vive and Oculus Rift CV1, there has been a lot of discussion about the state of the VR market. Lots of conversations have been brought up, from the size of the market to which headset is “winning” the race. That includes everything from articles to rather speculative Reddit posts, but I felt there was a lack of specific facts as the basis for drawing conclusions. In particular, Oculus and HTC don’t have any readily available information about exactly how many units they’ve sold.
As the owner of studio working on VR games, I don’t want to make decisions about the future of our company based on speculation. How likely our game is to be purchased, based on the decisions we make, matters a lot. What if we make the game only for the HTC Vive, only to find out that the market is stagnant? What if we only support Oculus but Vive is the winner? What kind of budget should we have for our game to guarantee profitability, or at least minimize the risk of losses?
Thanks to the establishment of the website SteamSpy, it’s now possible to get some reasonably accurate information about the state of the market on the largest digital distribution platform, Steam. This information doesn’t provide 100% accurate data and it does have some flaws. But what I decided to do was run a search for all VR-compatible games on Steam and tally up the information to get an idea of what the market looks like.
What follows is a collection of data for 100 Steam games that support VR, which actually constitutes every premium game on Steam for which SteamSpy had a complete data set. The information was pulled on May 23rd and doesn’t include games that were released so recently that the game’s ownership and player data couldn’t be fully counted, but I think this gives a more complete picture of the state of the market than is often discussed.
But before we get into the data, a couple of quick details.
Who Am I?
My name is Tristan Parrish Moore and my company, Broken Window Studios, has been working with VR since before we were even officially established in 2014. We’ve used all of the headsets dating back to the DK1, and have had a major focus on VR as a core goal for our studio’s games. We have two titles, Reflections and Grave, that currently support VR, with plans to incorporate VR experiences into all of our titles as a studio.
I personally have a few years of experience working in games, film and simulations. This includes doing work for military simulations, production on the movie Due Date, and a few other things. I Spent a few years working at THQ and at a company called Redacted Studios before branching out on my own efforts. It’s given me a chance to see things from a few different perspectives, and one of the things I’ve seen go wrong at a lot of companies is that they don’t fully evaluate their market or design goals.
DISCLAIMER
The following analysis provides a lot of useful information but should not be considered perfect. SteamSpy is still in beta and has some bugs. Not all of the data is 100% accurate and every game has a “margin of error” listed for it. In my experience with our game Reflections, the data from SteamSpy has pretty accurately matched our internal numbers, but was less accurate when the totals were lower directly following our launch.
This data also doesn’t include information about sales on non-Steam platforms, particularly Oculus Home, which does not provide public data. What it does show is information about Steam, which is the biggest online distribution service and the go-to outlet for the majority of gamers. Steam has over 125 million users, with over 12 million concurrently as of April. That means that while it may not be a complete picture, it likely gives a very representative sample of what to expect. Because I don’t have information about Oculus Home, however, I can’t factor that into the analysis.
Also, as I noted, this information was gathered on May 23rd, 2016 and took a while to collate into useful data. It does not account for changes that might have occurred in the following 2 weeks. I should also note that I only paid attention to paid titles, and left free or demo titles out of the equation.
Now for the information!
The Basics
The first thing I wanted to figure out was how many games on Steam currently use the Oculus, Vive or both.
This was a bit surprising, because 49% of the games/apps, almost half, only support the Vive, while only 14% of the apps only support Oculus. One of the immediate takeaways here is that if a consumer has just an HTC Vive, they can play 86% of all VR games on Steam, due to the games that only support Vive or games that support both. If you only have an Oculus Rift, you are going to be limited to 51% of the steam VR library. This obviously doesn’t count the Oculus Home store, as I’ve stated before; but how many PC gamers are going to want to buy games on a separate storefront when they use Steam for the majority of their gaming?
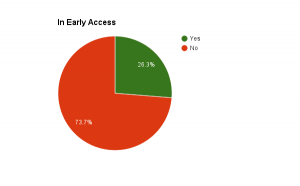
Another worthwhile factor to note is that only about 26% of the games in the VR marketplace are on Early Access. The vast majority, almost 74%, are full release titles.
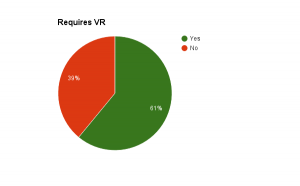
One element that was actually surprising to me was that 61% games actually required the use of a VR headset of some kind. This is likely due to the fact that many of the games feature room-scale VR and require specific design considerations which only work properly in a VR environment, or would require massive revisions to function as intended in a non-VR experience.
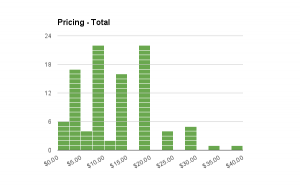
As far as pricing goes, there are some pretty clear patterns. The highest number of games are either between $7.50-9.99 or $17.50-19.99, 22 games in each of those brackets. Games in the $2.50-4.99 range coming in third with 17 games, and games at $12.50-14.99 coming in fourth with 16 games in that range. While there are games that exceed $19.99, there are actually very few, with no games over $39.99 and only 11 games in total priced at more than $20 dollars.
I’ll discuss in more detail what role the price plays in sales a little further down in this article.
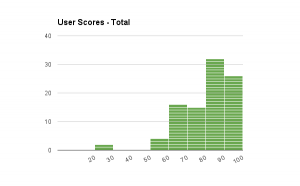
While this data is harder to draw any meaningful conclusions from, it’s pretty heartening to note that for the most part, people appear to be enjoying the VR experiences they play. Of all the games I evaluated, 26% had between a 91-100% rating. 94% had greater than a 60% rating, the majority of games, 58%, had an 81% positive rating or better. That either means that people love VR games, the current round of games are pretty great, or both.
Owner Statistics
So when looking at the total number of owners, there’s a couple of things to note. “Owners” aren’t explicitly purchasers, but they do tend to indicate how many people are likely to have purchased your game. The owners of the game include anyone who has the game, including keys that have been handed out for free, or keys that may have been acquired through alternate means such as bundles. It also doesn’t tell us if the owners paid full price or if they waited to purchase at a sale. Because of that, I tend to look at the owner statistics as a “maximum” rather than a real number of sales to expect.
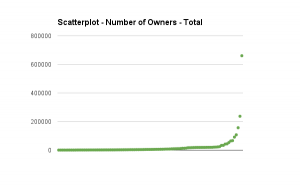
So the first really important thing to note is that this plot identified a few outliers. Particularly there are three games which stretch the chart’s Y axis, and those are:
- Subnautica – Oculus – 660,758 owners
- Keep Talking and Nobody Explodes – Vive and Oculus – 237,204 owners
- Universe Sandbox 2 – Vive – 156,917 owners
When you remove those three games, the chart provides a lot more information and is probably a lot more representative of the totals.
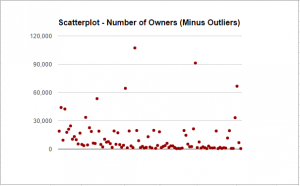
As you can see in this new chart, substantially more games are below the 30,000 owner line than above it. In fact, most of them are FAR below that line. To provide more context, here’s a table explaining it:
| Owners | Percent |
| Greater than 150,000 | 3% |
| Less than 100,000 | 96% |
| Less than 50,000 | 92% |
| Less Than 25,000 | 88% |
| Less than 15,000 | 70% |
| Less than 10,000 | 64% |
| Less than 5,000 | 50% |
| Less than 3,000 | 38% |
| Less than 2,000 | 31% |
| Less than 1,000 | 10% |
| Less than 500 | 0% |
The percentages correlate to the number of games, as the number of games in the data totalled 100. It is also worth noting that the data at the very bottom butts up against one of SteamSpy’s weaknesses, which is estimating numbers for games which have very low sales. It is quite possible that games on this list did sell less than 500 units, but that SteamSpy cannot accurately reflect this. However, if you wanted to estimate how many copies your game would sell, it might look something like this:
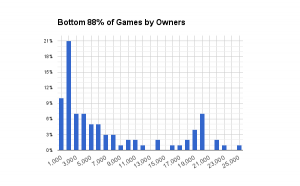
This graph shows that, interestingly, the largest number of games (21%) have between 1,000 and 2,000 owners. This rapidly drops off to very few as it reaches 10,000 units. However, there is an uptick in the number of games sold as it approaches 20,000 copies. In fact, 14% of the games in this sample sold between 15,000 and 20,000 copies, while only 6% sold between 10,000 and 15,000.
To break this all down into what I would consider “useful” ranges, we get something like this.
| Owners | Percentage |
| Less than 1,000 | 10% |
| Between 1,001 and 7,500 | 50% |
| Between 7,501 and 20,000 | 24% |
| Between 20,001 and 50,000 | 8% |
| Between 50,0001 and 100,000 | 4% |
| Over 100,000 | 4% |
These values don’t take into account the quality of the game, which obviously plays a huge factor in determining sales. But it’s interesting to note a few things. One, 21% of all the games sold between 1,000 and 2,000 copies, but the same percentage (21%) sold between 10,000 and 20,000 copies, so the odds are equally likely that your game could wind up in either of those brackets. Not only that, but selling between 1,000 and 7,500 copies is about as likely as winning a coin toss, with just slightly under that (40%) making over 7,500 sales.
So there’s some important things to take away from this. Obviously, the game’s quality factors in heavily, which can’t be represented with these graphs. However, if your game can make it’s money back by selling at least 1,000 copies, your VR game is currently absurdly likely (90%, based on the analyzed current market) to be profitable. However, if you are going to need to sell at least 20,000 copies to break even, you’re going to have to be one of the 16% of games that can actually do that based on this sample.
So what’s the size of the whole market on Steam? Well, the grand total is 3,419,879 owners of VR games. However, if you take out the three outliers mentioned earlier, the total is a much lower 2,365,713. Interestingly, those three games make up 31% of the sales of VR games on Steam!
Platform Comparisons
So, how does the owner figure stack up when comparing by platform? Are most of the owners grabbing HTC Vive games or Oculus games, or do they mainly get the ones that support both? Here’s what I found initially:
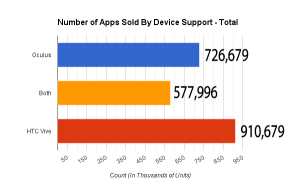
Initially, I thought this revealed a stunning discrepancy. Although the vast majority of games are being made for Vive, it looks like the majority of sales go to games that either support Oculus or both. Vive has the highest total number, but it’s not a blowout. This made me wonder if maybe Oculus is actually generating more sales per game than Vive. Then, I remembered the outliers.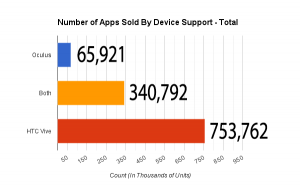
That’s right, when you eliminate 3 games, Subnautica, Universe Sandbox 2 and Keep Talking and Nobody Explodes, the numbers completely transform. Of the 97 other games in the sample, HTC Vive accounts for 65% of the total apps sold, a whopping 94% if you include games that support both Vive and Oculus.
That’s pretty interesting, especially because I went into this assuming Oculus was going to be the clear winner. So here’s a few visuals describing the differences per platform.
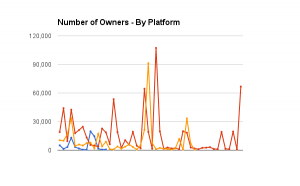
The red line is a graph of points for the number of sales for each Vive game in the sample. The yellow line is for each game that supports both, while the the blue line is for games that support Oculus Online. Ouch. Here’s the same data as a histogram, showing the 95 percentile of the data (not including the 5% outliers).
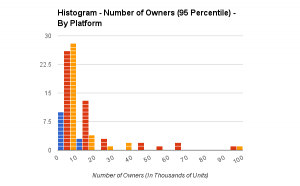
In the 95 percentile, Oculus-only games all have less than 20,000 owners. 77% of those (10 of the total games evaluated) have 10,000 owners or less. Finally, one last bit of information about platform.
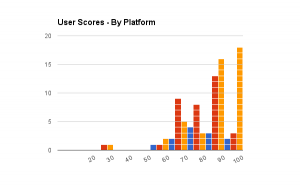
Although all the games in the list have similarly high scores overall, games that support both Vive and Oculus actually have the highest user scores overall, with the vast majority of their scores being situated between 80-100%. It’s pretty hard to tell what this means or how it can be applied, but it is still somewhat interesting. Perhaps there’s some correlation with being able to support both platforms and producing a more polished experience, but that’s a bit hard to say outside speculation.
How Various Factors Affect Owners
So let’s say we are developers and want to have the highest chance of our game succeeding in the marketplace. What factors would we want to put into account that might have the ability to affect our sales outcomes? Well fortunately, there’s a few we can look at, based on the information SteamSpy provides. Also, because of their impact on skewing the numbers, I’m eliminating our three outliers from the totals.
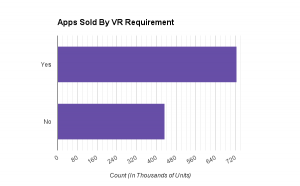
Oddly, your game is going to sell better if your game has the VR requirement than if it doesn’t, overall. Intuitively you’d assume that more people can play the game if it doesn’t require VR, but this probably also somewhat compromises the message or vision of the game as a VR experience. There are still a lot of games that sell without the requirement, but there’s a clear advantage to requiring VR, versus not doing so.
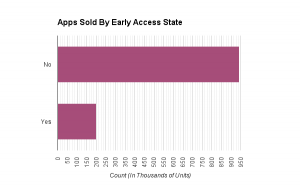
Games that aren’t in Early Access are massively more likely to sell, overall, than games that are still in Early Access. If you want to sell your VR game and make a profit, you’d do better to release a full version of the game instead of going into Early Access.
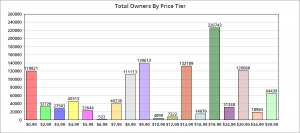
The largest total number of units are sold in the $19.99 bracket with 226,742 owners, with 9.99 being second at 139,612 owners and 14.99 being third with 132,189. It’s worth noting that the $0.99 tier is a bit skewed by one game that sold 107,282 copies. The other titles didn’t fare nearly as well. So what about the averages?
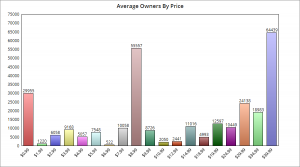
The averages aren’t 100% because they include outliers that skew the data, such as one game with 107,282 owners in the $0.99 tier, as mentioned above. One of two games in the $8.99 tier has 91,259, and the 39.99 tier is just one game with 64,439 owners. But there is still a clear overall trend upward as games get more expensive. It seems counter-intuitive, but people appear to be more likely to buy games as they get more expensive.
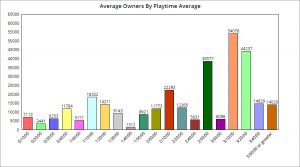
Average playtime also has an impact on total number of owners, as games with longer playtimes trend towards an uptick in owners overall. Interestingly, the highest number of average owners are between 3 hours and 3.66 hours of average playtime. If your game has between 2 hours and 3.66 hours of length, this range contains the four highest averages in number of owners. There are far fewer games that have average playtimes longer than 3.66 hours, and while longer playtimes do eliminate the low ranges (no game over 2.5 hours average playtime has fewer than 3,000 owners), there isn’t a direct correlation between playtime and average owners past 4 hours. The longest average playtime in this list, a game with a whopping 13.4 hours, only had 3,831 owners.
Bringing it All together
So what happens if we try to create the perfect game, that hits the sweet spot of all the categories above? The game would need to support Vive, NOT be in Early Access, and require VR support to get in the most statistically viable brackets. The game would also have to have a user score of 80% favorable or better, be priced at $8.99 or higher and have an average playtime of at least 1 hour. We should also remove the 3 major outliers to avoid skewing the data. If we filter for all of these factors, what do we get?
What we get in this aggressive filter is 11 games, or 11% of the games in the survey, which are as follows:
| Game | Device | User Score | Price | Owners |
| Hover Junkers | HTC Vive | 87 | $34.99 | 18,983 |
| A Chair in a Room: Greenwater | HTC Vive | 93 | $24.99 | 2,438 |
| The Gallery – Episode 1: Call of the Starseed | HTC Vive | 85 | $29.99 | 9,405 |
| Cloudlands: VR Minigolf | HTC Vive | 85 | $19.99 | 4,876 |
| theBlu | HTC Vive | 94 | $9.99 | 21,073 |
| Final Approach | HTC Vive | 95 | $24.99 | 24,556 |
| Nighttime Terror VR: Dessert Defender | Both | 83 | $9.99 | 3,657 |
| Space Pirate Trainer VR | HTC Vive | 97 | $14.99 | 42,495 |
| Audioshield | HTC Vive | 90 | $19.99 | 44,062 |
| Zombie Training Simulator | HTC Vive | 94 | $19.99 | 3,657 |
| Tilt Brush | HTC Vive | 98 | $29.99 | 66,703 |
What’s interesting to note about this group is that none of the games have less than 2,400 owners, and the average number of owners is 21,991. To wrap things up with a few more charts, here’s what we find in this group:
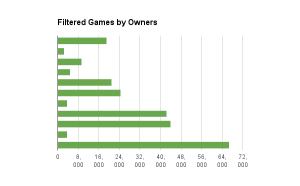
The Number of owners varies widely from 2,400 to 66,000 owners. There’s nothing below that range or above it, but over half of the games sold greater than 18,000 units.
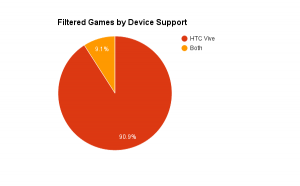
Almost all of the games in this group are actually Vive exclusive, 90.9% of the total.
Most games in this filtered group are $19.99 or greater.
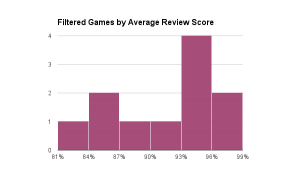
7 of the 11 games scored over a 90% in user scores. Oh thank Heaven.
While all these numbers are hardly conclusive for what to expect in sales, they do provide a window into what the range might be in the current marketplace, based on a set of criteria.
Final Thoughts
So now that I’ve given you the data, I want to provide you with a few of the take-aways that I had from the information and what it might mean for the burgeoning VR market, as well as for developers working in the industry.
Oculus vs. Vive
While Vive clearly has the upper hand on Steam, I cannot stress enough that these numbers do not include the Oculus Home store. Unlike Oculus, Steam is essentially the primary distribution platform for Vive games. It’s quite possible that Oculus is doing far better than these numbers suggest. However, not only is Steam a huge platform with tons of users, it also serves as a platform for users to find new content. If Oculus doesn’t have a good showing on Steam, there may be plenty of users unsure of which device to get who are being left in the dark about what Oculus is actually providing.
All this, at least to me, presents the inherent problem with the Oculus choice to go with a “walled garden” approach. People are used to playing games on Steam. They like getting achievements and sharing with their friends, and they like having one place where all their games are stored. Steam is a mature platform with a lot of features. The Rift is great piece of hardware, but Home is easily outmatched by a service like Steam and may create unneeded friction. Even if games on the Oculus Home store sell really well, they aren’t going to be as memetic as those that are part of the largest PC gaming ecosystem. I think this choice presents a serious problem for the long-term Oculus strategy.
Vive Exclusive Games
I think the main contributor to the success of the Vive is that players are responding to the extremely concise design philosophy behind the fusion of a VR headset and motion controllers. In my opinion, the decision to avoid launching Oculus with the Oculus Touch may be a stronger factor than the role that room-scale VR plays in the purchasing decision. Not only does Vive currently present a clearer vision of how a VR experience is supposed to work, but it also unifies the hardware expectations so developers can focus on a set of tools that they know the user will have.
Speaking as a developer myself, I think it’s problematic that Oculus has segmented the market by releasing an initial Rift offering without the Touch controller. Although I agree that Oculus Rift + Touch can do much of what Vive’s Room Scale does, Oculus has put developers in an awkward position because we now have to ask some fairly serious questions; If I make a game for Touch, how many users won’t have that device? Should we also support standard controllers to make sure the game works for the Oculus users that don’t own Touch? How many additional support tickets are we going to have for various configurations of a user’s setup, even if we do support all of these options? How many other games are going to support the controls we are using, and how much will Oculus be throwing behind which version of Oculus controls?
I don’t meant to imply that Oculus is doomed; in fact, I think there is a possibility that Oculus is picking a winning strategy by not pairing VR with motion controls, which have a spotty history to say the least. As things currently stand, it’s pretty likely that Vive is winning this early race, and that could posture it better for future growth.
Regarding Low Overall Sales Numbers
I think it’s important at this point in time to measure expectations of the future VR market, at least until things start to pick up speed. As I stated previously, 64% of the games currently on Steam have sold less than 10,000 copies, and it’s currently extremely unlikely to sell over 100,000. While that is likely to change in the coming months, the VR market is currently not a healthy place to sustain a AAA budgeted game that doesn’t have an alternate market. While games with budgets of under $100,000 have a reasonably good chance to return the investment, anything over that is a serious gamble, and anything over a $1,000,000 budget is bordering on impossible.
All that being said, it’s definitely worth noting that there are only a little over 100 premium games on the Steam store that support VR right now, in total. Compared to the over 6,000 games that are on Steam, you have a much chance to compete with a quality product.
Which leads me to my final point…
Room for a Runaway Hit
I think the most important thing to pay attention to is that there isn’t currently a VR-specific “killer app,” one that is driving sales for either of these devices. That doesn’t mean that it can’t come, or that one of us developers can’t be responsible for creating the next ultra-hit that serves as the “Angry Birds” for VR. To me, I actually see this as a great opportunity to be one of the early developers making interesting things happen with this burgeoning technology. The number of users purchasing VR games will only go up in the coming year, and creating something early that capitalizes on the need for more VR content can lead to some massive gains for developers, as well as for the consumers who get to play their games.
Thanks for giving this a read and I hope the information is helpful. At the very least, I hope this provides you with a little bit more than speculation the next time you discuss VR hardware in a heated debate. There’s a lot of potential in this market, and in VR as in anything, we benefit from having information, instead of just opinions or guesses.
VRFocus thanks Tristan for his input, if you’d like to find out more about VR be sure to follow us for all the latest news and updates.


